NAME
Chart - a series of charting modules
SYNOPSIS
use Chart::type; (type is one of: Points, Lines, Bars, LinesPoints, Composite,
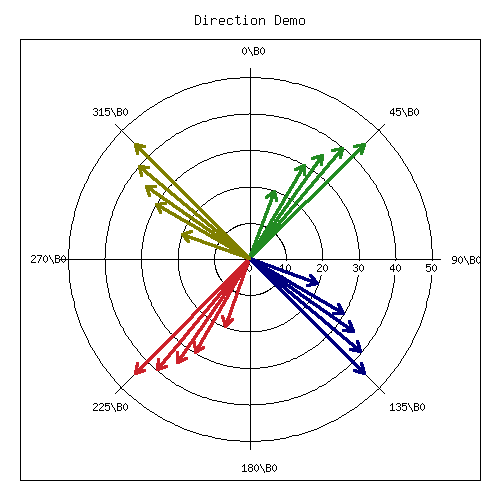
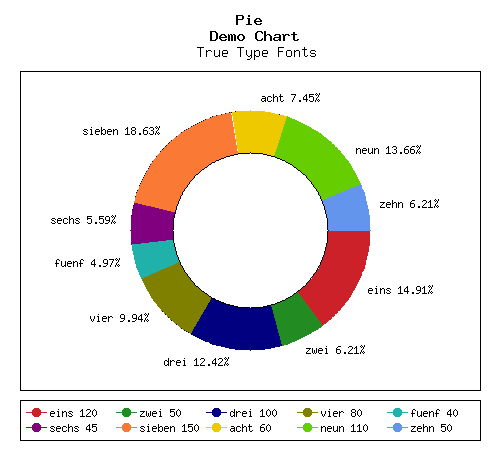
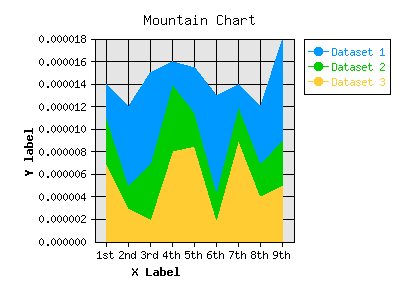
StackedBars, Mountain, Pie, HorizontalBars, Split, ErrorBars, Pareto, Direction)
$obj = Chart::type->new;
$obj = Chart::type->new ( $png_width, $png_height );
$obj->set ( $key_1, $val_1, ... ,$key_n, $val_n );
$obj->set ( $key_1 => $val_1,
...
$key_n => $val_n );
$obj->set ( %hash );
# GIFgraph.pm-style API to produce png formatted charts
@data = ( \@x_tick_labels, \@dataset1, ... , \@dataset_n );
$obj->png ( "filename", \@data );
$obj->png ( $filehandle, \@data );
$obj->png ( FILEHANDLE, \@data );
$obj->cgi_png ( \@data );
# Graph.pm-style API
$obj->add_pt ($label, $val_1, ... , $val_n);
$obj->add_dataset ($val_1, ... , $val_n);
$obj->png ( "filename" );
$obj->png ( $filehandle );
$obj->png ( FILEHANDLE );
$obj->cgi_png ();
The similar functions are available for j-peg
# Retrieve image map information
$obj->set ( 'imagemap' => 'true' );
$imagemap_ref = $obj->imagemap_dump ();DESCRIPTION
Chart helps you to create PNG and JPG images with visualizations of numeric data. This page gives you a summary how to use it. For a more thorough documentation and lots of example code please visit the Chart::Manual.

use-ing Chart
Okay, so you caught me. There's really no Chart::type module. All of the different chart types (Points, Lines, Bars, LinesPoints, Composite, StackedBars, Pie, Pareto, HorizontalBars, Split, ErrorBars, Direction and Mountain so far) are classes by themselves, each inheriting a bunch of methods from the Chart::Base class. Simply replace the word type with the type of chart you want and you're on your way. For example,
use Chart::Lines;would invoke the lines module. Alternatively load all chart types at ones and write:
use Chart;Getting an object
The new method can either be called without arguments, in which case it returns an object with the default image size (400x300 pixels), or you can specify the width and height of the image. Just remember to replace type with the type of graph you want. For example,
$obj = Chart::Bars->new (600,400);would return a Chart::Bars object containing a 600x400 pixel image. New also initializes most of the default variables, which you can subsequently change with the set method.
Setting different options
This is where the fun begins. Set looks for a hash of keys and values. You can pass it a hash that you've already constructed, like
  %hash = ( property_name => 'new value' );
  $obj->set (%hash);
or you can try just constructing the hash inside the set call, like
$obj->set ( property_name => 'new value' );Chart::Manual::Properties lists all currently supported keys and values.
GIFgraph.pm-style API
- Sending the image to a file
-
Invoking the png method causes the graph to be plotted and saved to a file. It takes the name of the output file and a reference to the data as arguments. For example,
$obj->png ("foo.png", \@data);would plot the data in @data, and the save the image to foo.png. Of course, this then beggars the question "What should @data look like?". Well, just like GIFgraph, @data should contain references to arrays of data, with the first array reference pointing to an array of x-tick labels. For example,
  @data = ( [ 'foo', 'bar', 'junk' ],
        [ 30.2,  23.5,  92.1   ] );
would set up a graph with one dataset, and three data points in that set. In general, the @data array should look something like
@data = ( \@x_tick_labels, \@dataset1, ... , \@dataset_n );And no worries, I make my own internal copy of the data, so that it doesn't mess with yours.
- CGI and Chart
-
Okay, so you're probably thinking, "Do I always have to save these images to disk? What if I want to use Chart to create dynamic images for my web site?" Well, here's the answer to that.
$obj->cgi_png ( \@data );The cgi_png method will print the chart, along with the appropriate http header, to stdout, allowing you to call chart-generating scripts directly from your html pages (ie. with a <lt>img src=image.pl<gt> HTML tag). The @data array should be set up the same way as for the normal png method.
column based API
You might ask, "But what if I just want to add a few points to the graph, and then display it, without all those references to references?". Well, friend, the solution is simple. Borrowing the add_pt idea from Matt Kruse's Graph module, you simply make a few calls to the add_pt method, like so:
    $obj->add_pt ('foo', 30, 25);
    $obj->add_pt ('bar', 16, 32);
Or, if you want to be able to add entire datasets, simply use the add_dataset method:
    $obj->add_dataset ('foo', 'bar');
    $obj->add_dataset (30, 16);
    $obj->add_dataset (25, 32);
These methods check to make sure that the points and datasets you are adding are the same size as the ones already there. So, if you have two datasets currently stored, and try to add a data point with three different values, it will carp (per the Carp module) an error message. Similarly, if you try to add a dataset with 4 data points, and all the other datasets have 3 data points, it will carp an error message.
Don't forget, when using this API, that I treat the first dataset as a series of x-tick labels. So, in the above examples, the graph would have two x-ticks, labeled 'foo' and 'bar', each with two data points. Pie and ErrorBars handle it different, look at the documentation to see how it works.
- Adding a datafile
-
You can also add a complete datafile to a chart object. Just use the add_datafile() method.
$obj->add_datafile('file', 'set' or 'pt');file can be the name of the data file or a filehandle. 'set' or 'pt is the type of the datafile. If the parameter is 'set' then each line in the data file has to be a complete data set. The value of the set has to be separated by white spaces. For example the file looks like this:
    'foo'  'bar'
    30     16
    25     32
If the parameter is 'pt', one line has to include all values of one data point separated by white spaces. For example:
'foo' 30 25 'bar' 16 32 - Clearing the data
-
A simple call to the clear_data method empties any values that may have been entered.
$obj->clear_data (); - Getting a copy of the data
-
If you want a copy of the data that has been added so far, make a call to the get_data method like so:
$dataref = $obj->get_data;It returns (you guessed it!) a reference to an array of references to datasets. So the x-tick labels would be stored as
@x_labels = @{$dataref->[0]}; - Sending the image to a file
-
If you just want to print this chart to a file, all you have to do is pass the name of the file to the png() method.
$obj->png ("foo.png"); - Sending the image to a filehandle
-
If you want to do something else with the image, you can also pass a filehandle (either a typeglob or a FileHandle object) to png, and it will print directly to that.
$obj->png ($filehandle); $obj->png (FILEHANDLE); - CGI and Chart
-
Okay, so you're probably thinking (again), "Do I always have to save these images to disk? What if I want to use Chart to create dynamic images for my web site?" Well, here's the answer to that.
$obj->cgi_png ();The cgi_png method will print the chart, along with the appropriate http header, to stdout, allowing you to call chart-generating scripts directly from your html pages (ie. with a <lt>img src=image.pl<gt> HTML tag).
- Produce a png image as a scalar
-
Like scalar_jpeg() the image is produced as a scalar so that the programmer-user can do whatever the heck s/he wants to with it:
$obj-scalar_png($dataref) - Produce a jpeg image as a scalar
-
Like scalar_png() the image is produced as a scalar so that the programmer-user can do whatever the heck s/he wants to with it:
$obj-scalar_jpeg($dataref)
Imagemap Support
Chart can also return the pixel positioning information so that you can create image maps from the pngs Chart generates. Simply set the 'imagemap' option to 'true' before you generate the png, then call the imagemap_dump() method afterwards to retrieve the information. You will be returned a data structure almost identical to the @data array described above to pass the data into Chart.
$imagemap_data = $obj->imagemap_dump ();Instead of single data values, you will be passed references to arrays of pixel information. For Bars, HorizontalBars and StackedBars charts, the arrays will contain two x-y pairs (specifying the upper left and lower right corner of the bar), like so
( $x1, $y1, $x2, $y2 ) = @{ $imagemap_data->[$dataset][$datapoint] };For Lines, Points, ErrorBars, Split and LinesPoints, the arrays will contain a single x-y pair (specifying the center of the point), like so
( $x, $y ) = @{ $imagemap_data->[$dataset][$datapoint] };A few caveats apply here. First of all, GD treats the upper-left corner of the png as the (0,0) point, so positive y values are measured from the top of the png, not the bottom. Second, these values will most likely contain long decimal values. GD, of course, has to truncate these to single pixel values. Since I don't know how GD does it, I can't truncate it the same way he does. In a worst-case scenario, this will result in an error of one pixel on your imagemap. If this is really an issue, your only option is to either experiment with it, or to contact Lincoln Stein and ask him. Third, please remember that the 0th dataset will be empty, since that's the place in the @data array for the data point labels.
PLAN
This module is currently under a complete rebuild, that will take place in two phases. First: rewrite all functionality within a modular architecture and hierarchical property system. This will be accessed via a central API using the so far unutilized Chart module 'my $c = Chart->new(...);'. This API will have in part different method and property names, but the old API will not be touched. In a second phase we will see hoch much new code can be used by the old modules and which new features can be brought to the legacy parts, which will be than discouraged, but not scrapped.
TO DO
Include True Type Fonts
Violine and Box plots
Add some 3-D graphs.
For more please check the TODO file.
BUGS
Probably quite a few, since it's been completely rewritten. As usual, please mail me with any bugs, patches, suggestions, comments, flames, death threats, etc.
AUTHOR
David Bonner (dbonner@cs.bu.edu)
MAINTAINER
Chart Group (Chart@fs.wettzell.de)
Herbert Breunung (lichtkind@cpan.org)
CONTRIBUTORS
Gregor Herrmann (gregoa@debian.org)
Chris Dolan (chris+rt@chrisdolan.net)
(jarmzet@yahoo.com)
Ricardo Signes (rjbs@cpan.org)
Petr Pisar (ppisar@redhat.com)
COPYRIGHT
Copyright(c) 1997-1998 by David Bonner, 1999 by Peter Clark, 2001 by the Chart group at BKG-Wettzell. 2022 by Herbert Breunung and Chart group
All rights reserved. This program is free software; you can redistribute it and/or modify it under the same terms as Perl itself.